

ROAS tells you whether a specific ad or campaign is pulling its weight. MER tells you whether your entire marketing operation is profitable once every dollar spent, on every channel, is counted against every dollar earned. Use ROAS to decide what to scale or kill inside a channel this week; use MER to decide how much total budget the business can afford this month. Neither replaces the other.
TL;DR:
- Platform ROAS can be inflated by attribution overlap, view-through conversions, and modeling errors, making it unreliable for true ad performance.
- Marketing efficiency ratio provides a more accurate business profitability measure by using actual store revenue and total marketing spend, including agency and influencer fees.
- Daily and weekly decisions should rely on platform ROAS, while monthly budgets and overall scaling should be guided by MER to ensure alignment with real margins.
- Divergence between high platform ROAS and flat or declining MER indicates attribution issues or inflated results, not necessarily profit or demand declines.
- Operationalizing MER requires regular reconciliation of store revenue, ad spend, and marketing costs, with automation based on MER targets to optimize actual profitability.
Table of Contents
- ROAS vs. MER: Formulas and Worked Examples
- When to Use ROAS vs. MER: A Decision Map
- How ROAS and MER Interact: Reading Divergence and Fixing It
- Why ROAS Can Mislead You (and How to Fix It)
- What Counts as a Good ROAS or MER, Once Margin Enters the Picture
- How to Operationalize MER Alongside ROAS
- How Agencies Actually Operationalize MER and ROAS
- The Real Lesson in the ROAS vs. MER Debate
- Get MER-Driven Automation Without Building It Yourself
- Sources
ROAS vs. MER: Formulas and Worked Examples
Return on ad spend measures attributed revenue against a specific ad or campaign's cost. The formula is simple: ROAS = attributed revenue ÷ ad spend. The catch is what "attributed" means. Ad platforms use their own attribution windows and often count view-through impressions or modeled conversions that never touched a real click, which is why platform-reported ROAS routinely runs hotter than reality.
Marketing efficiency ratio strips out the attribution guesswork entirely. MER = total revenue ÷ total marketing spend, using numbers straight from your store and your bank account rather than a platform's dashboard. Total marketing spend should include paid media across every channel, agency retainers, creator and influencer fees, and any tools or freelancers billed against customer acquisition. HubSpot defines MER this way specifically because it's platform-agnostic, which makes it far more reliable for executive reporting than any single channel's self-reported number.
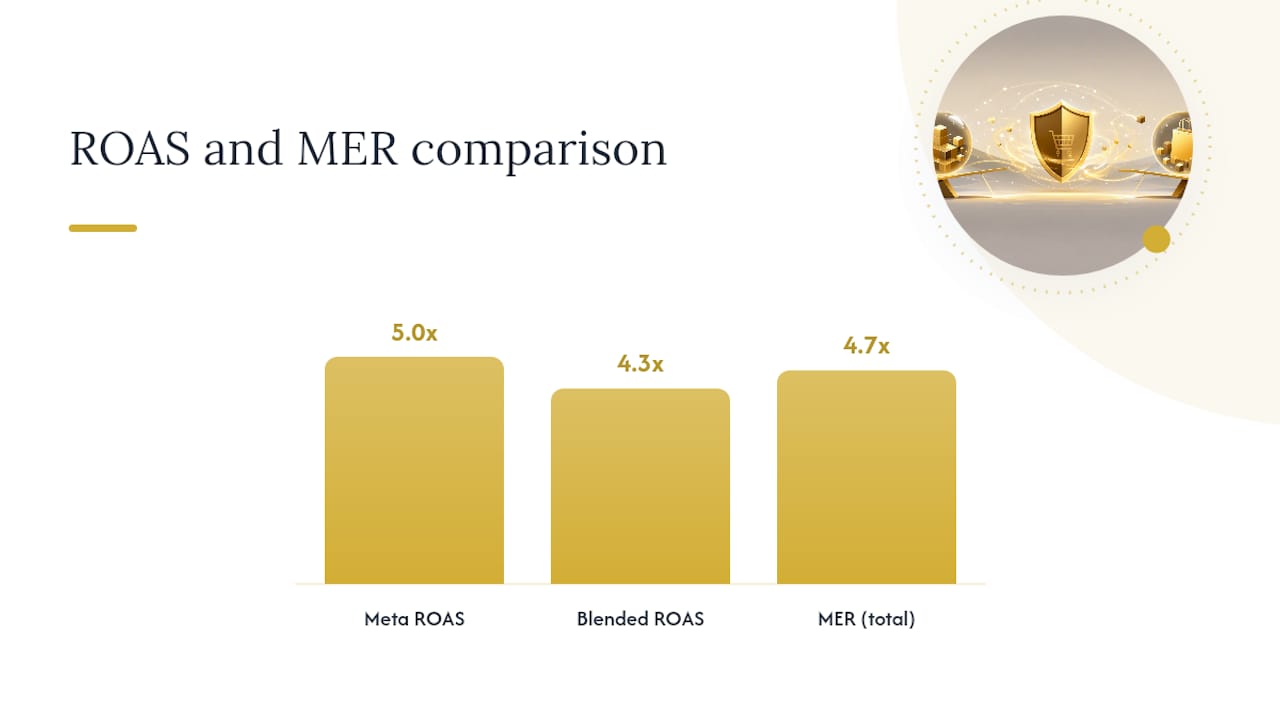
Here's how the three numbers can diverge in the same month for the same business:
- Platform ROAS (Meta): $40,000 attributed revenue ÷ $8,000 spend = 5.0x
- Blended ROAS (all paid media): $95,000 total paid-channel revenue ÷ $22,000 total ad spend = 4.3x
- MER (total revenue ÷ total marketing spend): $140,000 store revenue ÷ $30,000 total marketing cost (ads, $2,000 agency fee, $1,000 creator fees) = 4.7x
Pro Tip: Pull your MER inputs from three places every time: your ad platform invoices, your Shopify or ecommerce revenue report, and your accounting software's marketing expense ledger. If those three don't reconcile within a few percentage points, you're measuring fiction.
The gap between platform ROAS and blended ROAS in that example (5.0x versus 4.3x) is almost entirely a denominator problem: Meta only "sees" its own spend, not what you're paying on Google, TikTok, or an agency retainer.
When to Use ROAS vs. MER: A Decision Map
Confusing which metric answers which question is the single most common mistake teams make once they're running more than two channels. Here's a working framework:
- Daily and weekly campaign decisions belong to ROAS. Should you kill this ad set, raise this bid, or scale this creative? Platform ROAS, checked frequently, answers that.
- Creative and audience testing belongs to ROAS. You're comparing relative performance within one channel's attribution logic, so the platform's own number is internally consistent even if it's inflated in absolute terms.
- Monthly budget setting belongs to MER. How much can the business spend on marketing this month without eroding margin? That's a P&L question, and MER is the P&L-aligned answer.
- Investor and board reporting belongs to MER. MER is auditable against real revenue, so it holds up to scrutiny in a way a screenshot of a Meta dashboard never will.
- Scaling decisions belong to MER, then ROAS. Decide the total envelope with MER first, then use ROAS to allocate that envelope across channels.
Media buyers and channel managers should own ROAS day to day. A marketing director, CFO, or the founder should own MER, because it's the number that ties directly to cash flow and runway. A reasonable cadence: check platform ROAS daily, review blended ROAS weekly, and calculate MER monthly alongside your P&L close. Some teams automate a weekly Slack alert when blended ROAS and MER drift more than 15% apart. That drift is usually the first sign something in the data pipeline needs attention before it becomes a budgeting mistake.
How ROAS and MER Interact: Reading Divergence and Fixing It
When ROAS looks strong but MER is flat or declining, the gap is telling you something specific, not just "the metrics disagree."
- High platform ROAS, weak MER: Usually attribution overlap. Multiple platforms are claiming credit for the same sale, or view-through conversions are inflating one channel's number without adding incremental revenue.
- Declining ROAS, stable MER: Often a tracking issue, not a performance issue. iOS opt-outs and cookie restrictions have made platform-level attribution progressively less reliable since Apple's App Tracking Transparency rollout, even when real revenue hasn't moved.
- Both metrics falling together: That's a real demand or economics problem, not a measurement artifact. Time to look at pricing, offer, or market saturation.
A three-step troubleshooting workflow catches most of this:
- Verify the sources. Confirm your revenue figure matches your accounting system, not just Shopify's gross sales, and confirm your spend figure includes every invoice, not just what the ad platform reports.
- Check the economics. Run the revenue through contribution margin, factoring in COGS, fulfillment, and payment processing, before you conclude a campaign is profitable.
- Run a holdout or incrementality test. Geo holdouts or a simple on/off test for a channel will tell you whether that channel's platform-reported ROAS reflects real incremental revenue or just correlation. MER itself is a correlation metric, not proof of causality, so incrementality testing is still the only way to confirm a channel is actually driving sales rather than capturing demand that would have converted anyway.
Pro Tip: If your automation software lets you set bid targets, tie them to a MER-derived ROAS floor rather than the platform's suggested target. If MER tells you the business needs a 4.5x blended return to hit margin, set your Meta and Google bid strategies to that number, not to whatever "optimal" ROAS the platform recommends by default.
Favor MER-derived targets over raw platform ROAS whenever you're setting automated bidding rules across more than one channel. Platform algorithms optimize for their own attribution model, not your P&L.
Why ROAS Can Mislead You (and How to Fix It)
A 5x ROAS sounds great until you realize it doesn't account for the cost of the product you sold, the box it shipped in, or the portion of orders that came back weeks later. ROAS was never designed to measure profitability; it measures ad efficiency, and those are different things.
The most common ways ROAS gets distorted:
- Attribution overlap and view-through inflation. Platforms claim credit for sales that another channel, or no ad at all, actually drove.
- iOS opt-outs. Modeled conversions fill gaps left by users who declined tracking, and the model isn't always right.
- Return and refund timing. A sale counted on day one that gets refunded on day twenty-one still shows up in that day's ROAS, overstating performance retroactively.
- Hidden costs the formula ignores entirely. COGS, fulfillment, payment processing fees, and agency or creator retainers never touch the ROAS calculation but absolutely touch your bank account.
The fix isn't complicated, just disciplined. Reconcile ad platform revenue against your accounting system's actual deposits at least monthly. Build a blended ROAS that includes agency and creator fees in the denominator as a middle check between platform ROAS and full MER. And track contribution margin (CM3) alongside ROAS so a campaign with an impressive multiple but negative unit economics doesn't get scaled further before someone notices.
What Counts as a Good ROAS or MER, Once Margin Enters the Picture
There's no universal "good" number for either metric because margin changes the math entirely. A business with 70% gross margin can survive a lower ROAS than one running at 35%.
That said, MER in the range of 3.0 to 5.0 is a commonly cited target for scaling ecommerce brands, with anything above 5.0 generally considered strong. Lower-margin categories, think grocery, beverage, or low-ticket consumables, typically need a higher MER to stay profitable, while high-margin categories like apparel or beauty can operate comfortably at the lower end of that range.
Platform ROAS benchmarks vary too much by channel and vertical to state a single "good" number responsibly. What matters more than the absolute figure is whether that ROAS survives contact with your real costs. Two quick examples:
- Example A (35% gross margin, $50 AOV): A 4x ROAS on paid social nets $200 revenue for every $50 spent. After COGS ($32.50) and fulfillment ($8), contribution margin is roughly $109.50, or about 55% CM3.
- Example B (55% gross margin, $50 AOV): The same 4x ROAS produces $200 revenue against $22.50 COGS and $8 fulfillment, for a CM3 near $169.50, or 85%.
Same ROAS, wildly different business health. That's why MER, anchored to your actual margin structure, matters more than any channel's headline number.
How to Operationalize MER Alongside ROAS
Getting MER into your regular reporting isn't complicated, but it does require pulling data from places that don't usually talk to each other.
Data you need each cycle:
- Total store revenue, net of refunds, from Shopify, WooCommerce, or your order management system.
- Total ad spend across every platform, pulled directly from platform billing, not campaign-level "recommended budget" screens.
- Agency retainer invoices and creator/influencer payments for the same period.
- Refund and return totals for the period, so early-period revenue isn't overstated.
Recommended cadence:
- Daily: Check platform ROAS on active campaigns for obvious performance swings.
- Weekly: Review blended ROAS across all paid channels to catch cross-platform attribution overlap.
- Monthly: Calculate MER and tie it out against your actual P&L close, ideally the same week your accounting team closes the books.
Setting automation targets: Start with your MER envelope, the total marketing spend your margin structure can support, then divide that budget across channels using each channel's relative platform ROAS as the allocation guide. MER sets the ceiling; ROAS decides how the money under that ceiling gets spent.
Checklist to avoid the usual mistakes:
- Confirm attribution windows match across platforms before comparing them.
- Exclude sales tax and shipping revenue from marketing revenue calculations unless your cost basis includes them too.
- Recalculate MER after any major refund cycle, not just at month end.
- Never let a platform's "in-platform ROAS" substitute for a reconciled blended number in a board deck.
How Agencies Actually Operationalize MER and ROAS
Most agencies still report platform ROAS because it's what the ad dashboards hand them. Leapify Media builds the reporting layer differently: unify store revenue, ad spend, and marketing costs into one system, then let MER, not any single platform's number, set the ceiling that automated bidding rules operate under.
That matters most for home service businesses running Google Local Service Ads alongside Meta and organic lead flow, where attribution across channels is notoriously messy and a booked job rarely traces back cleanly to one ad click. Leapify's on-premise infrastructure keeps that revenue and spend data in-house rather than routing it through third-party AI tools, which matters when client acquisition costs and margin data are involved. Leapify Media reports a 20x return on ad spend across its home service partnerships, a number that only holds up because it's measured against actual booked and paid jobs, not modeled conversions.
Building this in-house takes real engineering time. Hiring a partner makes sense once you're running enough channels that reconciling them by hand each month is eating more hours than the marketing team can spare.
The Real Lesson in the ROAS vs. MER Debate
Most of the advice floating around treats ROAS versus MER as a decision to pick one metric and retire the other. That framing misses the actual problem. Teams don't fail because they tracked the wrong number; they fail because they let a channel-level metric make a company-level decision, or vice versa.
The bigger issue I'd flag: too many brands install MER as a vanity number they glance at monthly, without ever wiring it into how bids actually get set. A MER target that never touches your automation rules is just a slide in a board deck. The real work is the unglamorous part, reconciling revenue and spend data every week until the number can be trusted, then letting that number cap the budget before the platforms get to spend it.
Prioritize the reconciliation first. Get platform ROAS, blended ROAS, and MER to tell a consistent story before you worry about optimizing any of them.
— Everson Gorski
Get MER-Driven Automation Without Building It Yourself
Reconciling ad platform data, agency invoices, and store revenue every week is the part most in-house teams underestimate, and it's exactly where MER tracking tends to fall apart. Leapify Media builds that infrastructure for home service businesses directly: unifying revenue and spend data, setting MER-aligned spend envelopes, and automating bid decisions inside those envelopes rather than chasing whatever a single platform's dashboard reports.
This fits home service operators, HVAC, plumbing, roofing, electrical, restoration, running enough ad spend across Google Ads and Meta that manual reconciliation has become its own part-time job. Because Leapify runs on-premise AI infrastructure instead of routing client data through third-party tools, revenue and spend figures stay proprietary while still feeding directly into automated bidding rules built around your actual margin, not a platform's optimistic attribution model.
If your team is ready to stop guessing at the gap between platform ROAS and what's actually landing in the bank, visit this detailed Google Ads for Real Estate Agents guide to see proven tactics for improving ROAS with better ad management.