

Lifetime value tracking measures the total revenue (or profit) a customer generates across their entire relationship with your business, and it starts paying off the moment you stop guessing and start measuring. The first move: build a 90 or 180-day cohort LTV grid before touching any predictive model. This single number tells you which acquisition channels actually deserve your budget, because it's grounded in cash that already hit your books, not a forecast.
TL;DR:
- Using a 90 to 180-day cohort LTV grid provides a grounded benchmark for acquisition channel profitability, avoiding reliance on uncertain forecasts.
- The most appropriate formula for your situation should consider margins and churn, with B2B and subscription models favoring margin-adjusted or monthly calculations.
- Tracking customer lifetime value alongside metrics like LTV to CAC ratio, churn types, and payback period helps identify profit potential and retention opportunities.
- Reliable LTV measurement requires integrating billing, CRM, and marketing data within a warehouse, ensuring correct identity resolution and accounting for timing effects.
- Common errors include relying on averages that hide outliers, ignoring gross margins, duplicate customer records, and trusting predictive models without operational review.
Table of Contents
- What Does LTV Actually Mean, and Which Formula Should You Use?
- What Metrics Should You Track Alongside LTV?
- How Do You Actually Measure and Track LTV Across Your Stack?
- Cohort LTV or Predictive LTV: Which Do You Actually Need?
- How Do You Put LTV to Work in CRM, Bidding, and Retention?
- How Often Should You Recalculate LTV, and What Should You Watch Monthly?
- What Are the Most Common LTV Measurement Mistakes?
- Implementation Patterns Leapify Uses for Home Service Clients
- How Leapify Media Builds Production-Grade LTV Tracking for Home Service Companies
- Sources
What Does LTV Actually Mean, and Which Formula Should You Use?
Lifetime value (LTV) and customer lifetime value (CLV) are the same metric wearing two different name tags. Marketers say LTV. Finance teams and B2B analysts tend to say CLV. Use them interchangeably in your own reporting, but pick one term internally so your dashboards and Slack threads don't fragment into two conversations about the same number.
Three formulas cover almost every situation you will run into:
- Basic LTV: Average order value × purchase frequency × customer lifespan. Fast to calculate, useful for a rough gut check on e-commerce, but it treats every customer as equally profitable, which they never are.
- Margin-adjusted CLV: (Average revenue per account × gross margin %) ÷ revenue churn rate. This is the formula subscription and B2B companies should default to, because it accounts for the fact that revenue and profit are not the same thing.
- Subscription-specific formula: Same structure as margin-adjusted CLV, just applied monthly instead of annually, which matters when your churn rate itself shifts month to month.
The margin-adjusted version comes recommended by Wall Street Prep precisely because plain ARPA times frequency times lifespan falls apart once you're dealing with variable churn and thin service margins. A home service company charging $400 for an HVAC tune-up but spending $150 on labor and dispatch has a very different LTV than the raw revenue figure suggests.
Whichever formula you pick, defend your time horizon out loud. A 12-month LTV and a 36-month LTV will produce wildly different numbers for the same customer base, and if your team can't explain why they chose one over the other, your CAC targets will drift out of sync with reality within two quarters.
What Metrics Should You Track Alongside LTV?
LTV means nothing floating on its own. It needs a partner metric, and that partner is customer acquisition cost, expressed as the LTV:CAC ratio.

A healthy B2B business generally runs an LTV:CAC ratio around three times or higher, according to Onramp's analysis of CLV optimization. Below that, you're spending too much to acquire customers relative to what they're worth. Well above 5:1 or 6:1, you might actually be underinvesting in growth, leaving profitable acquisition channels on the table.
Churn deserves more granularity than most dashboards give it:
- Logo churn: the customer cancels outright.
- Revenue churn: the customer downgrades but stays, shrinking your revenue without a full cancellation.
- Engagement churn: usage quietly drops before either of the above happens, and it's your earliest warning sign.
Churn sits in the denominator of the margin-adjusted CLV formula, which means small improvements compound fast. Reducing your churn rate by half significantly increases CLV, roughly doubling it, per the same Onramp research, making retention the highest-leverage lever most teams underuse. Pair every LTV figure with gross margin and payback period (how many months of revenue it takes to recoup CAC). A business with a 3:1 LTV:CAC ratio but an 18-month payback period has a cash flow problem hiding behind a healthy-looking headline number.
How Do You Actually Measure and Track LTV Across Your Stack?
Reliable LTV tracking depends on data you're probably already collecting, just not in one place. Here's the build order:
- Inventory your data sources. You need billing/payment records, CRM contact and deal history, ad platform source and click IDs, product or service usage logs, and support/service cost data. Miss any one of these and your LTV number will be directionally wrong.
- Solve identity resolution first. Before you calculate anything, confirm that a customer who called from a Google Ads number, then booked online, then paid by check, resolves to one customer record, not three. This is the single most common reason LTV numbers look inflated or deflated compared to reality.
- Build server-side joins, not spreadsheet lookups. Manual joins between billing exports and CRM exports break the moment someone renames a column. Server-side joins in your pipeline catch schema drift before it corrupts a quarter of reporting.
- Land everything in a warehouse. A modern setup pipes billing, CRM, and marketing data via ELT into a warehouse like BigQuery or Snowflake, refreshed nightly, according to the architecture MLDeep recommends for CLV tracking. This becomes your single source of truth, so marketing, finance, and ops stop arguing over whose spreadsheet is correct.
- Account for time-to-cash. Refunds, cancellations, and payment terms all distort present-value economics if you ignore timing. A customer who pays net-60 has different cash flow value than one who pays on booking, even at identical contract value.
Pro Tip: Run your identity resolution audit quarterly, not once at setup. Home service businesses especially tend to accumulate duplicate customer records as people call from a new phone, use a spouse's name, or book through a different channel than last time.
Handle refunds and cancellations by netting them out at the transaction level, not the aggregate level. Netting at the aggregate level hides which specific cohort or channel is driving the losses.
Cohort LTV or Predictive LTV: Which Do You Actually Need?
Cohort analysis groups customers by acquisition date, then tracks cumulative revenue at fixed ages, typically 30, 60, 90, 180, and 365 days out. This structure exists specifically to avoid what's known as the average trap, where one huge account or one unusually loyal customer skews your entire LTV figure into fiction.
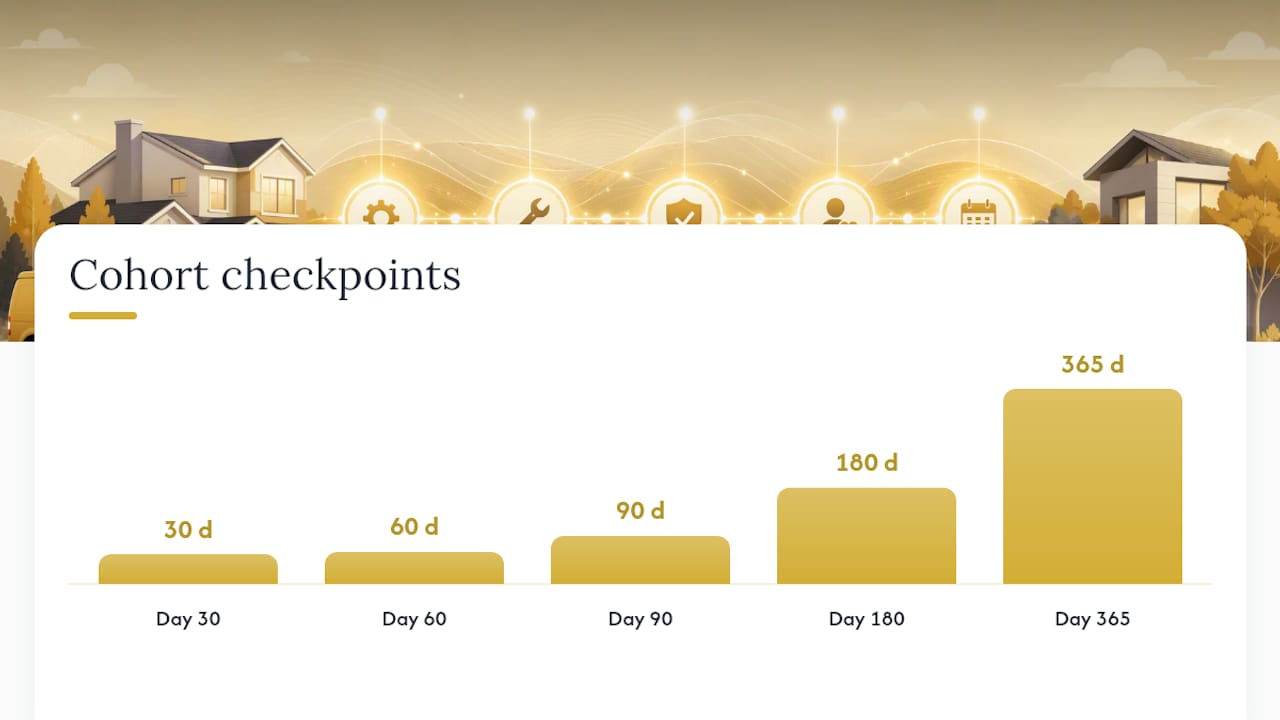
Building a cohort grid is the practical first step Shopify recommends for most businesses, because it sidesteps infinite-horizon forecasting entirely. You're not predicting what a customer will do in year five. You're reporting what customers acquired in a given month actually did by day 90, which gives you a defensible, channel-level number you can act on immediately.
Predictive LTV comes later, once you have the data maturity to support it:
- At least 12 to 18 months of clean, joined historical data across cohorts.
- Enough transaction volume per channel to model variance, not just averages.
- A defined set of input features: acquisition channel, first-purchase category, onboarding completion, early usage signals.
For B2B specifically, the more rigorous approach models three separate curves per cohort, a logo survival curve, an expansion curve, and a cost-to-serve curve, then combines them into a distribution rather than a single number. Backtest any predictive model by holding out the most recent complete cohort and comparing predicted 90-day LTV against actual results before you trust it for budget decisions.
How Do You Put LTV to Work in CRM, Bidding, and Retention?
A number sitting in a spreadsheet doesn't change anything. LTV earns its keep when it's wired into the systems your team already touches every day.
Start with your CRM. Persist predicted LTV and a confidence interval as fields on every customer record, refreshed monthly, an approach detailed in Data Innovation's guide to B2B CLV. This isn't a reporting exercise. It becomes a live routing input.
From there:
- Set channel-specific CAC ceilings using segmented LTV, not a blended average. Your Facebook-acquired customers and your referral customers rarely have the same value curve.
- Feed conversion value back into ad platforms so bidding algorithms optimize toward high-LTV conversions, not just any conversion. This is the practical mechanics behind ltv in Google Ads campaigns using value-based bidding.
- Route predicted high-LTV accounts to your most experienced account managers or senior customer success staff. Routing by predicted value, not just deal size, catches accounts worth protecting before they show warning signs.
- Trigger lifecycle automation off LTV thresholds: onboarding intensity for high-potential accounts, earlier dunning outreach for at-risk revenue, expansion nudges timed to usage milestones.
Pro Tip: If you're a home service business, tie your dispatch and follow-up automation to the same customer record that holds LTV. A CRM automation setup that already tracks job history is most of the way to tracking LTV; you're adding a calculation layer, not rebuilding from scratch.
How Often Should You Recalculate LTV, and What Should You Watch Monthly?
Recalculate full LTV on a quarterly cadence. That's frequent enough to catch real shifts without chasing noise, and it matches the pace at which cohort data actually matures into something trustworthy.
Between those quarterly recalculations, track leading indicators monthly, because LTV improvements from retention or onboarding work can take over a year to fully show up in the headline number, according to Zendesk's research on customer analytics. Waiting for LTV itself to move before you know a change is working means waiting a year or two for confirmation you needed months ago.
Watch these monthly instead:
- Time to first value: how fast a new customer experiences the core benefit they paid for.
- Onboarding completion rate: the percentage who finish the setup steps that predict long-term retention.
- Day-30 and Day-90 CSAT: satisfaction scores at those specific milestones, not just an annual survey average.
- Product or service adoption depth: how many features or service lines a customer actually uses.
Structure any retention experiment around one of these indicators as its primary KPI, with a 60 to 90-day window. That's short enough to get a read before your next quarterly LTV recalculation, so you walk into that review already knowing which levers moved the needle.
What Are the Most Common LTV Measurement Mistakes?
Most bad LTV numbers trace back to one of four repeatable mistakes, and each has a fast diagnostic.
- The average trap: check your median LTV against your mean. A big gap means a handful of outlier accounts are distorting your reported average, and you need cohort grids, not a single blended figure.
- Ignoring gross margin: audit whether your formula includes cost-to-serve, support costs, and onboarding expense. A high-revenue account with expensive service demands can quietly be unprofitable, a risk Data Innovation flags specifically for B2B accounts.
- Broken identity joins: run a duplicate-detection query on customer records tied to the same phone number, email domain, or billing address. Duplicates inflate customer counts and quietly deflate your per-customer LTV.
- Trusting predictive models without a human loop: model accuracy gains matter less than what your team actually does with the signal. Operational review and fast action on flagged accounts move the needle more than a marginally better algorithm.
Pro Tip: Before presenting any LTV figure to leadership, run the median-versus-mean check first. It takes five minutes and catches the single most common credibility problem in LTV reporting.
Implementation Patterns Leapify Uses for Home Service Clients
Home service businesses have a structural advantage in LTV tracking that most industries don't: every job ties back to a phone call, a booking, and a paid invoice, all within a tight window. The hard part isn't collecting the data. It's resolving identity across call tracking, CRM, and billing systems that were never built to talk to each other, then keeping that data on infrastructure the business actually controls.
Their approach leans on on-premise data handling and in-house AI-enabled lead routing specifically because home service data (customer addresses, service history, payment details) carries real sensitivity, and third-party AI platforms create a dependency most owners never fully see until something breaks. Clients working this way typically see improved lead conversion because routing decisions are informed by actual job and revenue history, not a generic scoring model.
Building this in-house makes sense once you have dedicated data engineering capacity. Most home service operators don't, and that's the case for hiring it out.
— Everson Gorski
How Leapify Media Builds Production-Grade LTV Tracking for Home Service Companies
This is a practical alternative to piecing together LTV tracking from disconnected tools and a marketing agency that only sees ad spend, not job history. The advantage is straightforward: your billing, CRM, call tracking, and dispatch data live on infrastructure built specifically for home service operations, resolved into one customer identity instead of scattered across systems that don't talk to each other.
This matters most for HVAC, plumbing, roofing, landscaping, restoration, and electrical companies doing at least $500,000 in annual revenue, where a handful of high-value repeat accounts often outweigh a much larger pool of one-time jobs, and where knowing the difference should drive your ad spend. Leapify Media builds the CRM automation and identity resolution layer that makes LTV segmentation possible, then connects it to call tracking and lead follow-up systems so acquisition source data doesn't get lost between the first phone call and the paid invoice.
If your team is ready to stop guessing which channels produce your best long-term customers, start with the services overview to see how the pipeline and automation work gets structured for your business.
Sources
- Lifetime value (Wall Street Prep)
- Customer analytics and lifetime customer value (Zendesk blog)
- Customer Lifetime Value Calculation and Optimization for Growth (Onramp)
- Customer lifetime value analysis (Shopify blog)